We ❤️ Open Source
A community education resource
What is OpenTelemetry and how to add it to your Django application
A step-by-step guide to connecting your Django app’s OpenTelemetry setup to an Elastic observability backend.

OpenTelemetry is an open source, vendor-neutral way to add monitoring features to your application. It is designed to allow you to monitor different systems using different backends in a standardized way. Django is a commonly used web application framework in Python that gives you a starting point for building on top of it.
This blog post aims to demystify OpenTelemetry and walk you through how to monitor a simple to-do list application with Django with it that connects to Elastic as its observability backend. The accompanying code sample can be found on GitHub.
What is OpenTelemetry?
OpenTelemetry is an open source observability framework that allows you to monitor different services and platforms seamlessly. OpenTelemetry is vendor-neutral and intended to be future-proof, so as the tools you use change, you will be able to monitor them similarly. It provides standardized APIs, libraries, and tools to collect telemetry data. OpenTelemetry was founded in early 2019 as a merger of two existing open source projects, OpenTracing and OpenCensus. OpenTelemetry is a work in progress; things constantly change and improve.
Read more: Why AI won’t replace developers
Observability basics
By analyzing its output data, observability helps you determine what’s happening inside your system. It goes beyond detecting problems; instead, it’s the why, not just the state. Observability is also about understanding the impact of issues on users by analyzing how failures affect end-users and other dependent services within the system. Knowing the effect helps prioritize fixes based on urgency and potential business impact.
There are three types of observability data – metrics, logs, and traces.
- Metrics – Quantitative measurements that track a system’s performance or health.
- Logs – Anything you can print to a console. They are records of events in a system.
- Traces – Traces track the path of a request through a system.
Spans within traces? What?!?!?!?
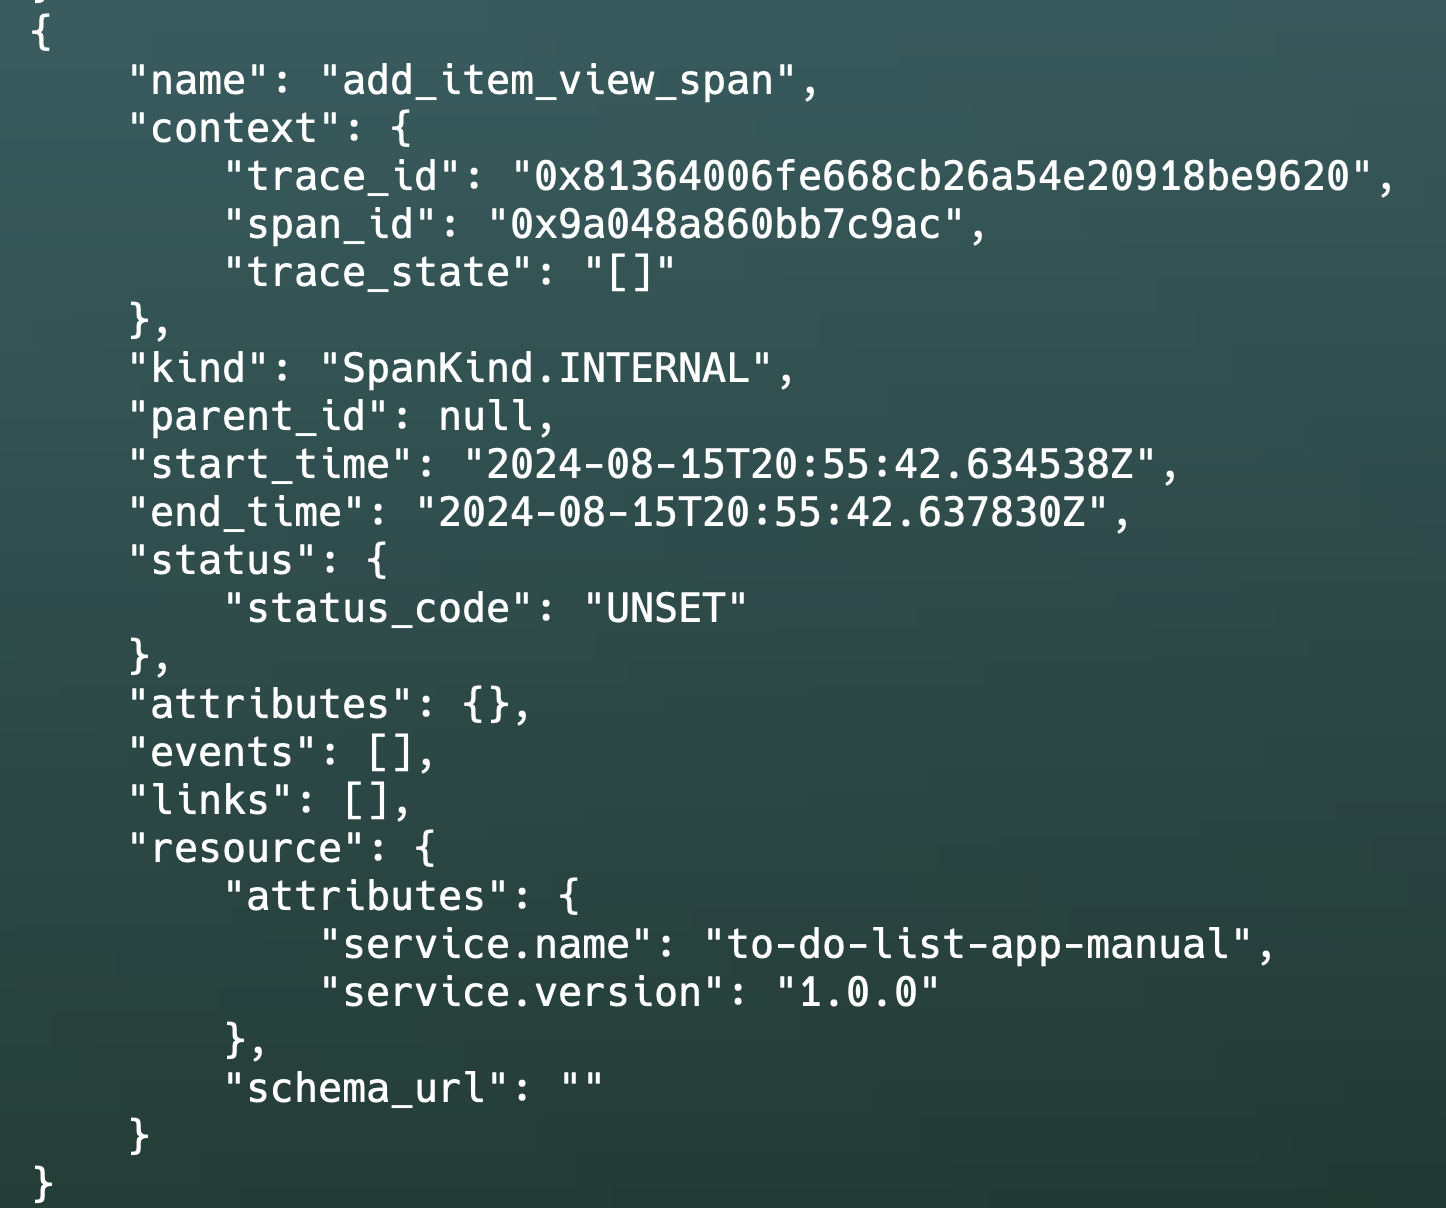
One common pitfall with OpenTelemetry is that spans are nested within traces, which can be slightly confusing at first. Spans are the building blocks of traces. They include a name and the parent span ID; this is empty for root spans. Ron Nathaniel, in his talk at PyCon 2023, describes a trace as a family and a span as a person in the family.
Here is a typical example of a span you would see in a Django context:

What you need to get started
First, you will want to set up a virtual environment. On a Mac this will look like the following:
python -m venv venv
source venv/bin/activate
On Windows this looks like this:
python -m venv venv
.\venv\Scripts\activate
To get started, you can install the following packages:
pip install django django-environ elastic-opentelemetry opentelemetry-instrumentation-django
opentelemetry-bootstrap --action=install
You will be using Django as your web framework, django-environ to allow you to set up a .env file, and Django-Instrumention will enable you to connect your Django application to OpenTelemetry easily.
For this post, you will also use Elastic Distribution of OpenTelemetry Python to connect easily to OpenTelemetry and Elastic. This library is a version of OpenTelemetry Python with additional features and support for integrating OpenTelemetry with Elastic. It is important to note that this package is currently in a preview and should not be used in a production environment.
Automatic vs manual instrumentation
Instrumentation is the process of adding the ability to collect observability features to your application. There are two options for instrumenting your application: Automatic and manual instrumentation.
- Automatic instrumentation adds a monitoring code to your application, so you don’t have to add any code. It can be an excellent starting point for adding OpenTelemetry to an existing application.
- With manual instrumentation, you add custom code segments to your application. This is helpful if you want to customize your monitoring or find that automatic instrumentation doesn’t cover everything you need.
Automatic instrumentation
You can add minimal code to your Flask application to add automatic instrumentation. Follow these steps to add automatic instrumentation to your application.
Step 1: Create a .env file
To get started with automatic instrumentation, you must create a .env file that includes your authentication header and Elastic endpoint. To avoid future issues, be sure to add this to your application’s .gitgnore file.
OTEL_EXPORTER_OTLP_HEADERS="Authorization=ApiKey%20yourapikey"
OTEL_EXPORTER_OTLP_ENDPOINT= "your/host/endpoint"
Step 2: Update your settings.py file
After, you will want to update your settings.py file to parse the variables you added to your .env file.
env = environ.Env()

environ.Env.read_env(os.path.join(BASE_DIR, '.env'))

OTEL_EXPORTER_OTLP_HEADERS = env('OTEL_EXPORTER_OTLP_HEADERS')
OTEL_EXPORTER_OTLP_ENDPOINT = env('OTEL_EXPORTER_OTLP_ENDPOINT')
Step 3: Update your manage.py file
From here, you will want to update your manage.py file to include the proper import statements for OpenTelemetry. Additionally, you must add to DjangoInstrumentor().instrument() which will automatically insert monitoring code into your application. You can also set up a service name and version for the application. The BatchSpanProcessor exports traces to your backend observability provider, which in this case is Elastic.
#!/usr/bin/env python
"""Django's command-line utility for administrative tasks."""
import os
import sys
from opentelemetry.instrumentation.django import DjangoInstrumentor
from opentelemetry import trace
from opentelemetry.sdk.trace import TracerProvider
from opentelemetry.sdk.trace.export import BatchSpanProcessor
from opentelemetry.exporter.otlp.proto.grpc.trace_exporter import OTLPSpanExporter
from opentelemetry.sdk import resources

def main():
   """Run administrative tasks."""
   os.environ.setdefault("DJANGO_SETTINGS_MODULE", "todolist_project.settings")
   DjangoInstrumentor().instrument()

   # Set up resource attributes for the service
   resource = resources.Resource(attributes={
       resources.SERVICE_NAME: "to-do-list-app",
       resources.SERVICE_VERSION: "1.0.0"
   })

   trace_provider = TracerProvider(resource=resource)
   trace.set_tracer_provider(trace_provider)

   otlp_exporter = OTLPSpanExporter()

   # Set up the BatchSpanProcessor to export traces
   span_processor = BatchSpanProcessor(otlp_exporter)
   trace.get_tracer_provider().add_span_processor(span_processor)

   try:
       from django.core.management import execute_from_command_line
   except ImportError as exc:
       raise ImportError(
           "Couldn't import Django. Are you sure it's installed and "
           "available on your PYTHONPATH environment variable? Did you "
           "forget to activate a virtual environment?"
       ) from exc
   execute_from_command_line(sys.argv)


if __name__ == "__main__":
   main()
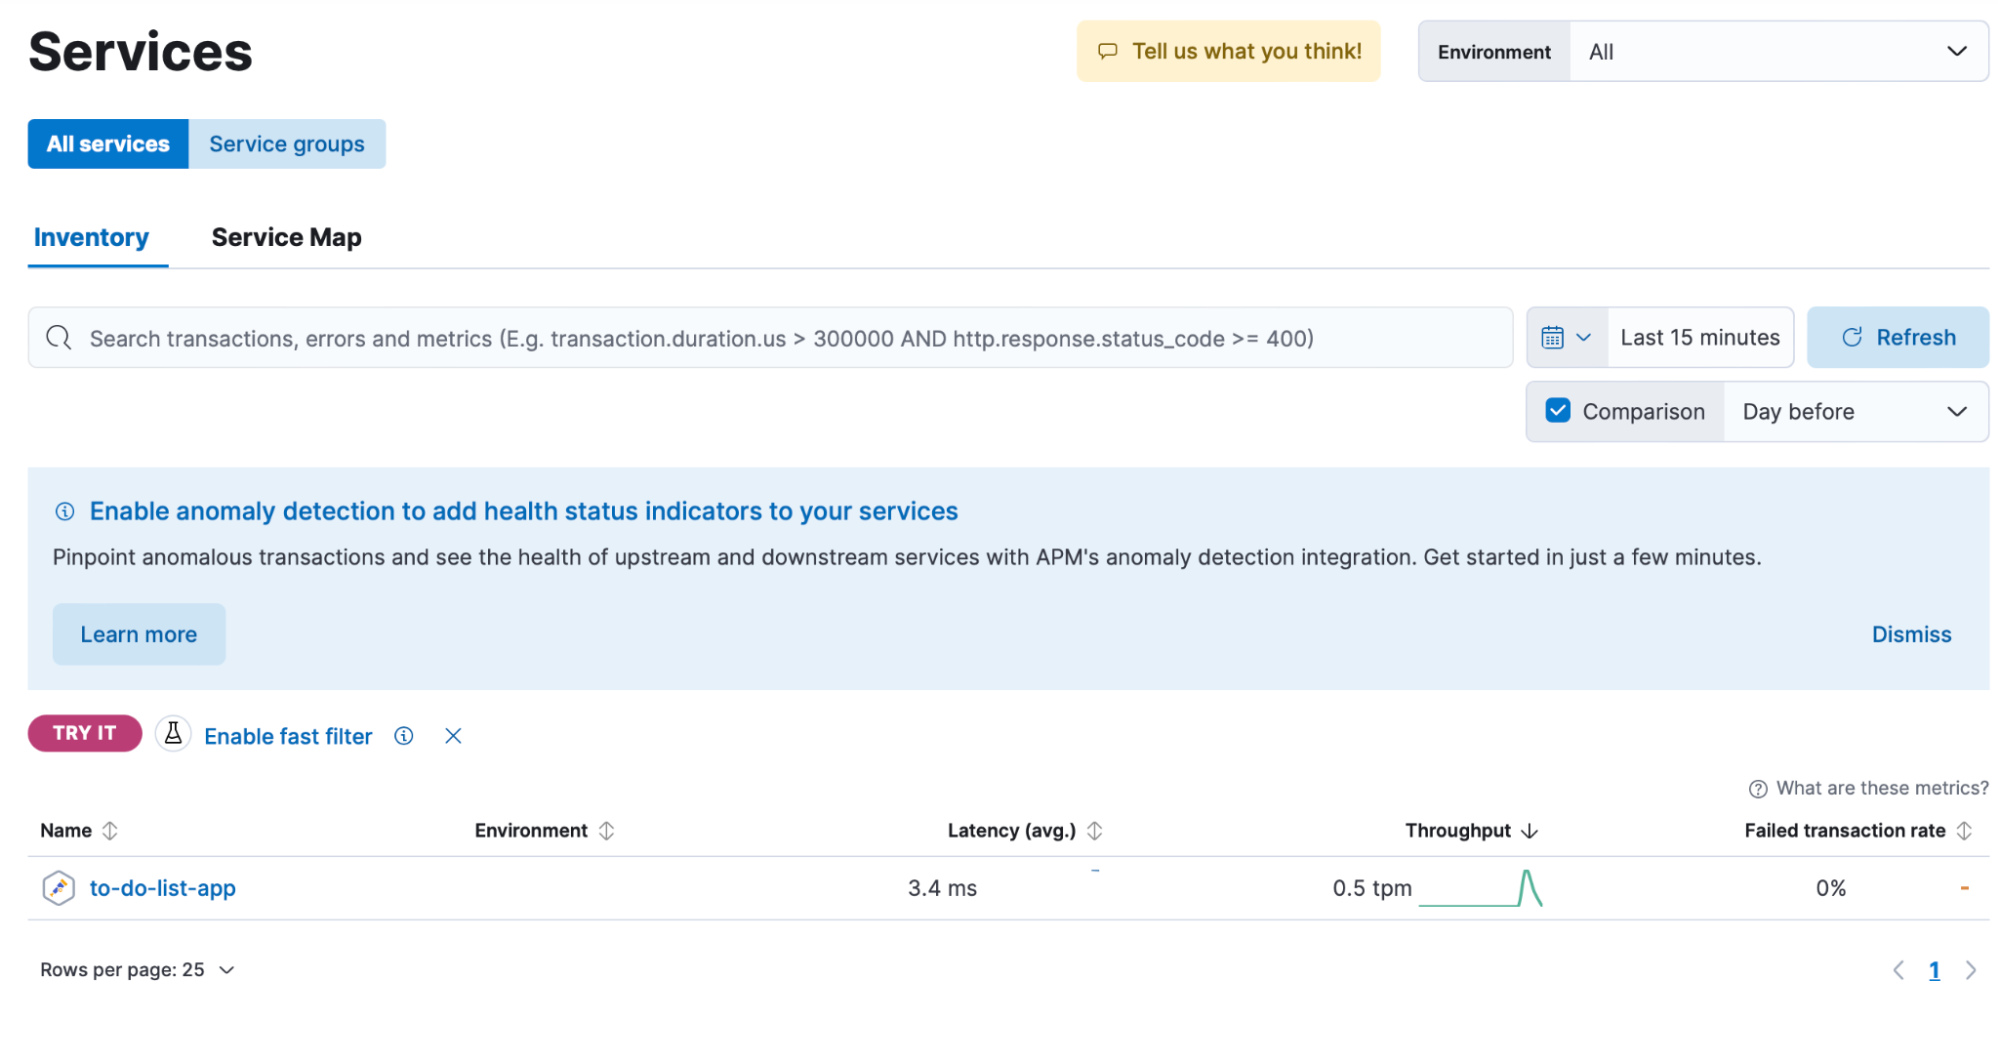
After running your application, if you look in Kibana, where it says “observability” followed by “services”, you should see your service listed as the service name you set in your manage.py file.

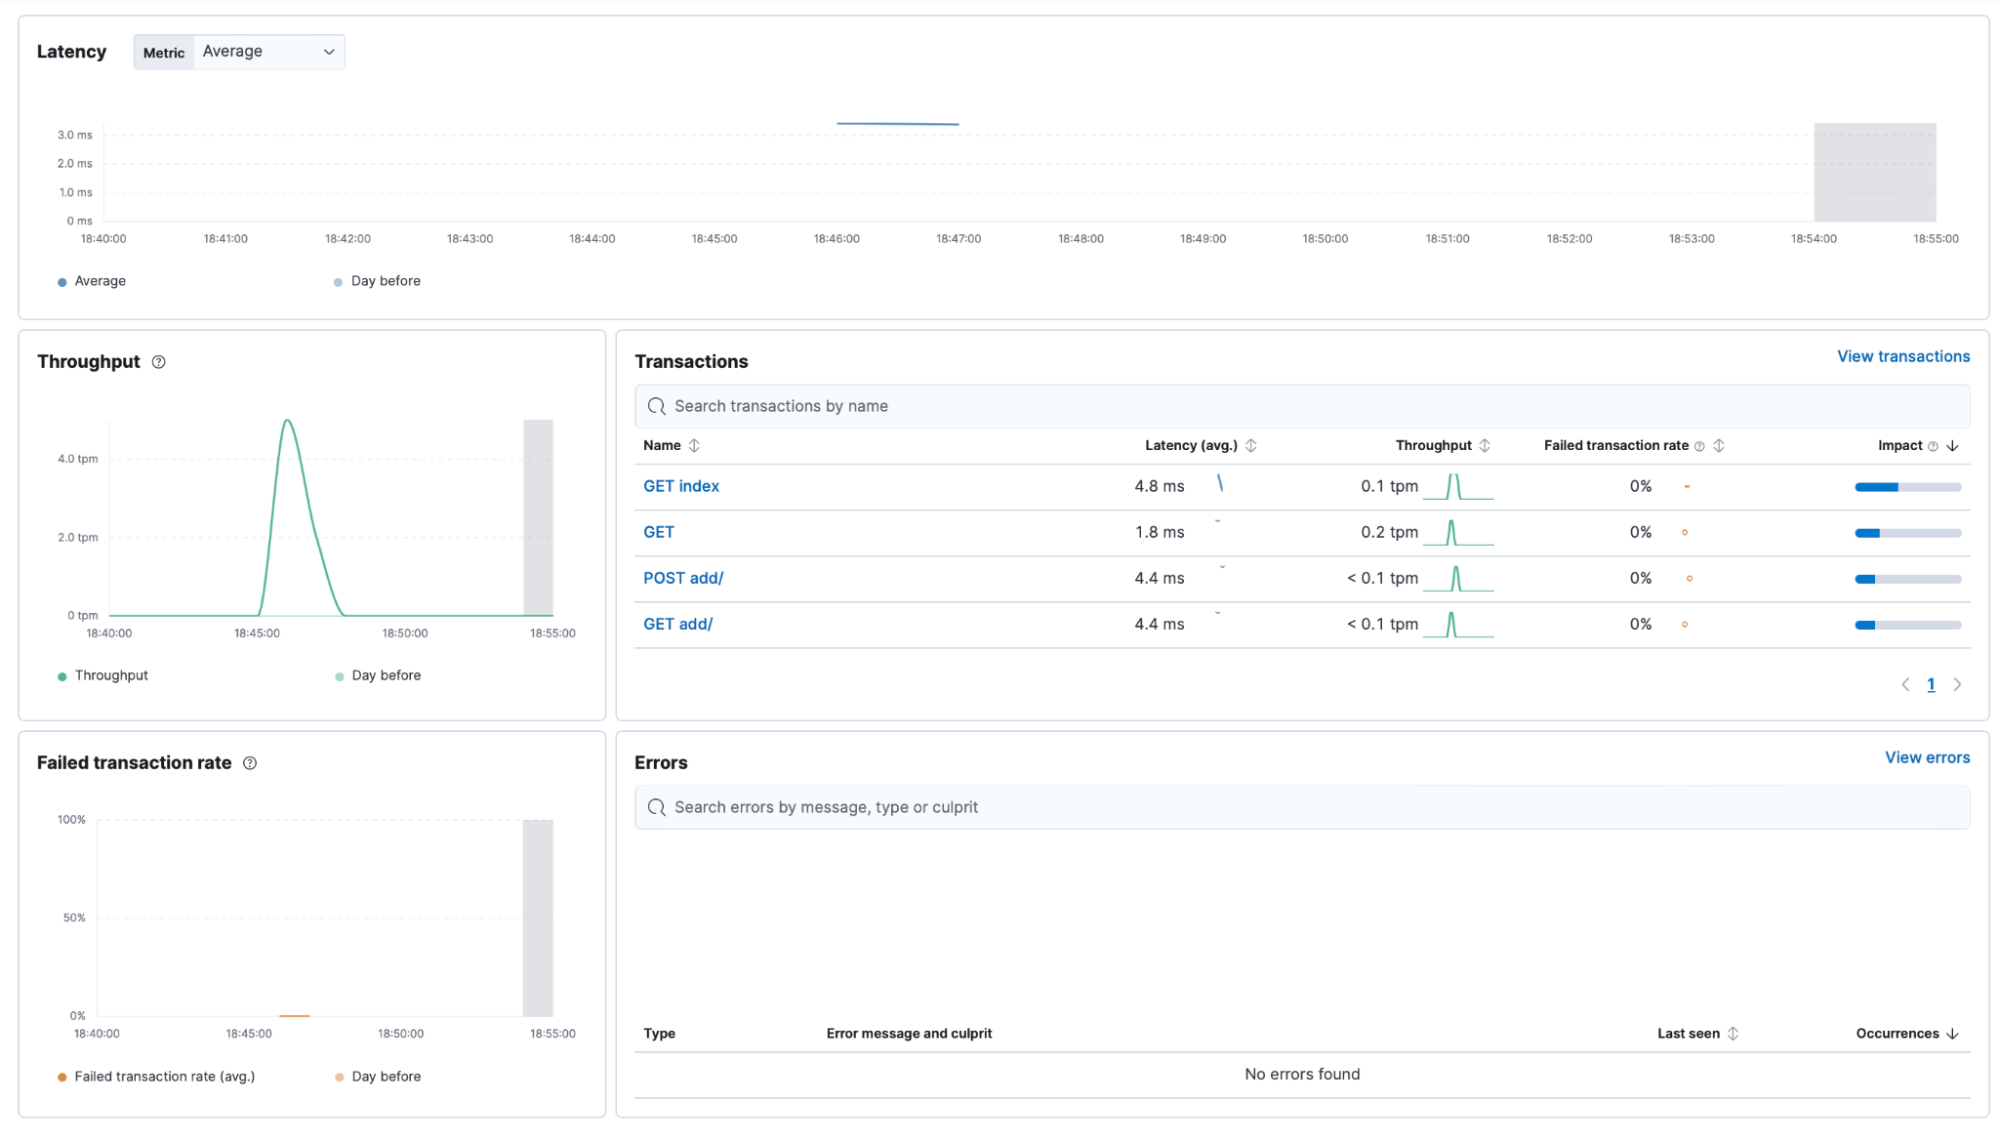
If you click on your service name, you should see a dashboard that contains observability data from your to-do list application. The screenshot below in the “Transactions” section shows the HTTP requests you made such as GET and POST as well as information about the latency, throughput, failed transaction rate and errors.

Manual instrumentation
Manual instrumentation allows you to customize your instrumentation to your liking, you must add your own monitoring code to your application to get this up and running.
Step 1: Remove automatic instrumentation from your manage.py
To do this you must first comment out the following from your mange.py file.
DjangoInstrumentor().instrument()Depending on your preference you may also want to update your service name to be something like to-do-list-app-manual.
Step 2: Update your views.py file
Configure your application to generate, batch, and send trace data to Elastic for insights into performance. Set up a tracer for distributed tracing, a meter, and a counter to capture operational metrics like request counts. These metrics will be batched and sent to your observability backend.
Equip each route (GET, POST, DELETE) with tracing and metrics to monitor performance and gather data on user interactions and system efficiency.
from django.shortcuts import render, redirect, get_object_or_404
from .models import ToDoItem
from .forms import ToDoForm
from opentelemetry import trace
from opentelemetry.metrics import get_meter
from time import time

tracer = trace.get_tracer(__name__)

meter = get_meter(__name__)

view_counter = meter.create_counter(
   "view_requests",
   description="Counts the number of requests to views",
)

view_duration_histogram = meter.create_histogram(
   "view_duration",
   description="Measures the duration of view execution",
)

def index(request):
   start_time = time()

   with tracer.start_as_current_span("index_view_span") as span:
       items = ToDoItem.objects.all()
       span.set_attribute("todo.item_count", items.count())
       response = render(request, 'todo/index.html', {'items': items})

   view_counter.add(1, {"view_name": "index"})
   view_duration_histogram.record(time() - start_time, {"view_name": "index"})

   return response

def add_item(request):
   start_time = time()

   with tracer.start_as_current_span("add_item_view_span") as span:
       if request.method == 'POST':
           form = ToDoForm(request.POST)
           if form.is_valid():
               form.save()
               span.add_event("New item added")
               response = redirect('index')
           else:
               response = render(request, 'todo/add_item.html', {'form': form})
       else:
           form = ToDoForm()
           response = render(request, 'todo/add_item.html', {'form': form})

   view_counter.add(1, {"view_name": "add_item"})
   view_duration_histogram.record(time() - start_time, {"view_name": "add_item"})

   return response

def delete_item(request, item_id):
   start_time = time()

   with tracer.start_as_current_span("delete_item_view_span") as span:
       item = get_object_or_404(ToDoItem, id=item_id)
       span.set_attribute("todo.item_id", item_id)
       if request.method == 'POST':
           item.delete()
           span.add_event("Item deleted")
           response = redirect('index')
       else:
           response = render(request, 'todo/delete_item.html', {'item': item})

   view_counter.add(1, {"view_name": "delete_item"})
   view_duration_histogram.record(time() - start_time, {"view_name": "delete_item"})

   return response
Step 3: Update your models.py file
Finally, you will want to update your models.py file to send tracing data to OpenTelemetry.
from django.db import models
from opentelemetry import trace

tracer = trace.get_tracer(__name__)

class ToDoItem(models.Model):
   title = models.CharField(max_length=100)
   description = models.TextField(blank=True)
   created_at = models.DateTimeField(auto_now_add=True)

   def __str__(self):
       return self.title

   def save(self, *args, **kwargs):
       with tracer.start_as_current_span("save_todo_item_span") as span:
           span.set_attribute("todo.title", self.title)
           if self.pk:
               span.add_event("Updating To Do Item")
           else:
               span.add_event("Creating new To Do Item")

           super(ToDoItem, self).save(*args, **kwargs)
Just like with automatic instrumentation, after you run your application, you will be able to see your application listed in Kibana as so:

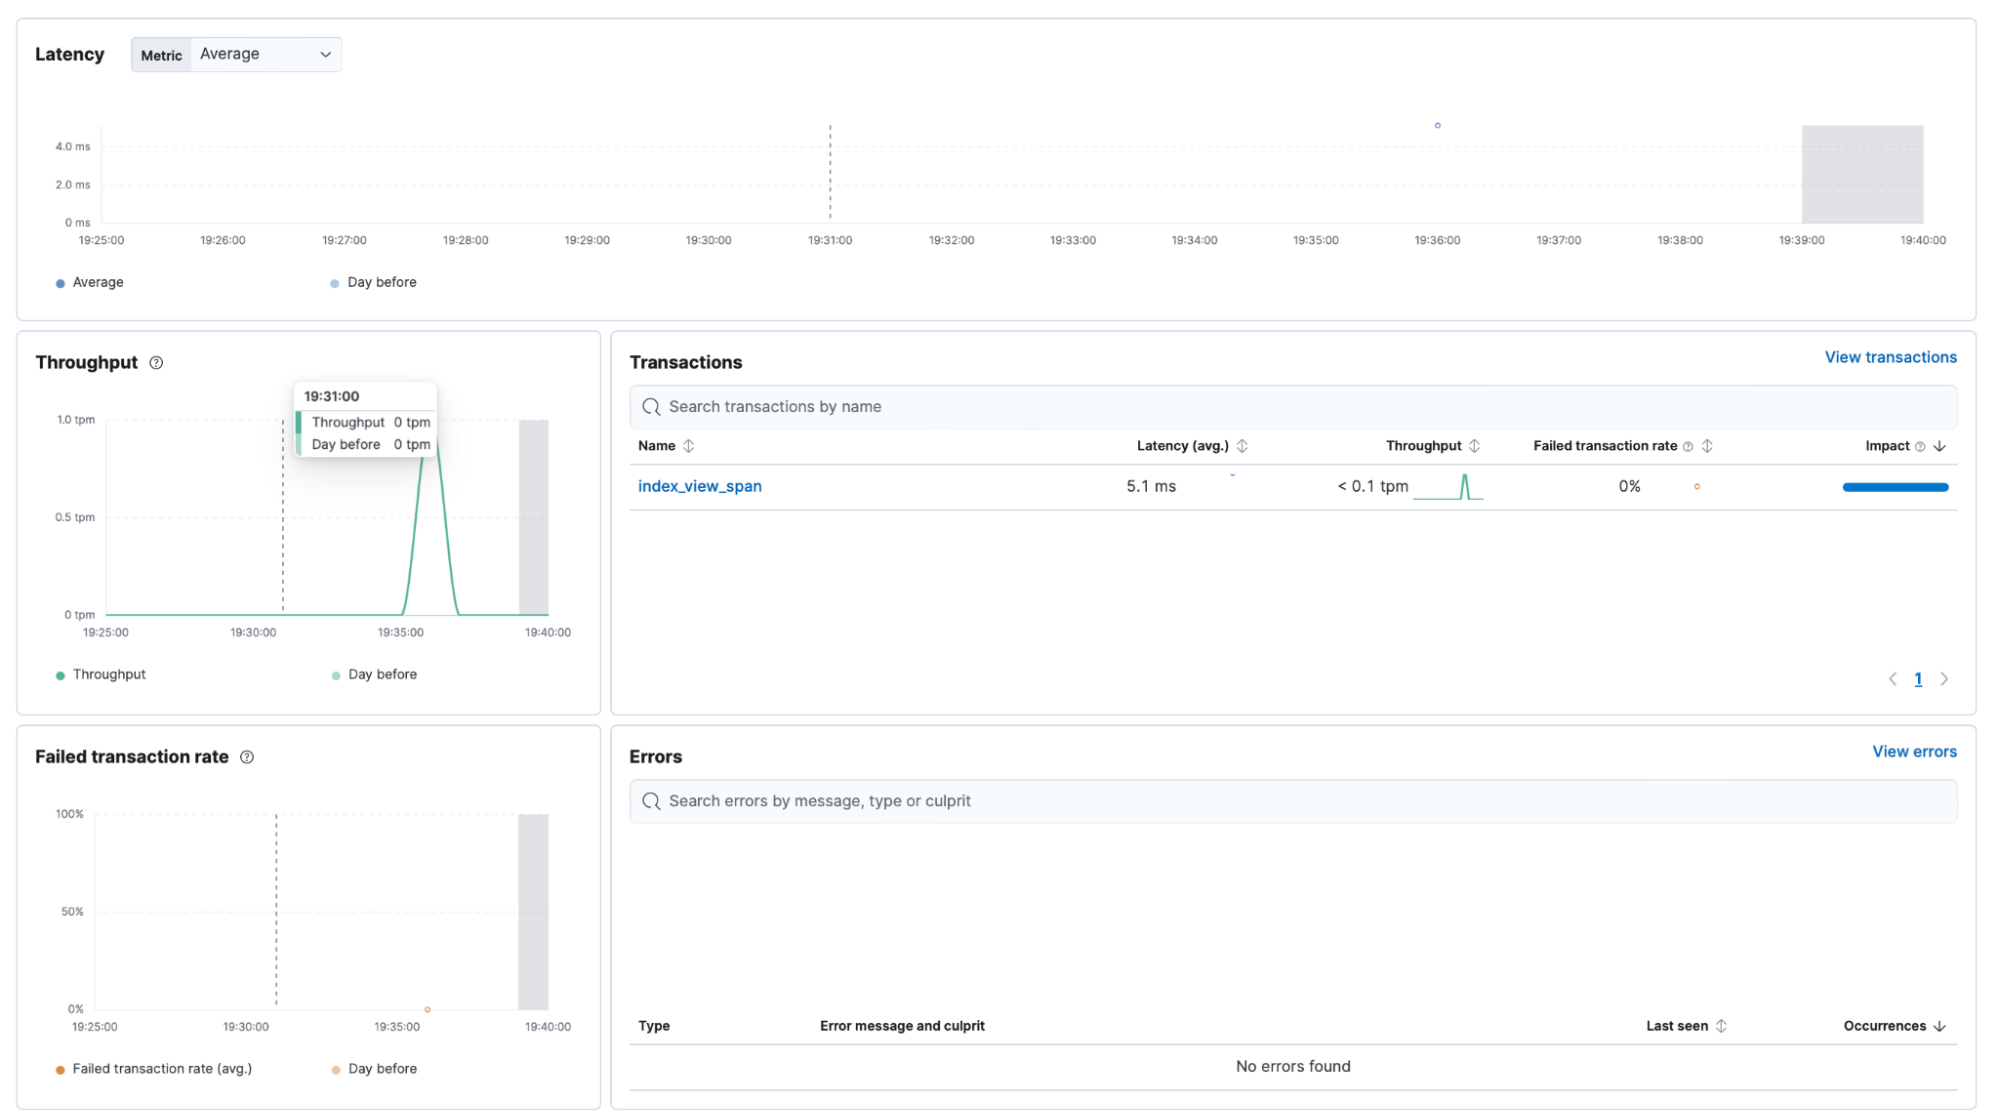
After clicking on the service that corresponds to the service name you set in your manage.py file, you will be able to see a dashboard that looks similar to the following:

Conclusion
Since one of the great features of OpenTelemetry is its customization, this is just the start of how you can use it. As a next step, you can explore the OpenTelemetry demo to see a more realistic application. You can also check the following resources to learn more.
More from We Love Open Source
- Why AI won’t replace developers
- Comparing GitHub Copilot and Codeium
- Getting started with Llamafile tutorial
- How Netflix uses an innovative approach to technical debt
The opinions expressed on this website are those of each author, not of the author's employer or All Things Open/We Love Open Source.
