Open Source 101 2021 Summary – Nearly 1,350 registered from all over the globe
April 5, 2021In a word Open Source 101 was.... fantastic!
While the 2021 edition was hosted virtually (we would have preferred an in-person conference), the upside is that more people registered and participated than ever before. Nearly 1,350 technologists took part in some way and took advantage of the opportunity the 40+ sessions and speakers made possible.
This year's event was the 8th Open Source 101 we've hosted over the last 5 years and planning for the 2022 series is already underway. In the meantime, work is fully underway preparing for All Things Open 2021 taking place later this year in October.
Highlights and observations of OS101 2021 are included below. We'd also like to thank everyone for their amazing support of the conference. We are incredibly thankful and appreciative.
Contact us at info@allthingsopen.org with questions or comments, as always.

 TAKE-AWAY OBSERVATIONS
- More people registered this year than ever before - ~1,350. We sincerely hope all are better prepared to contribute to and consume open source moving forward.
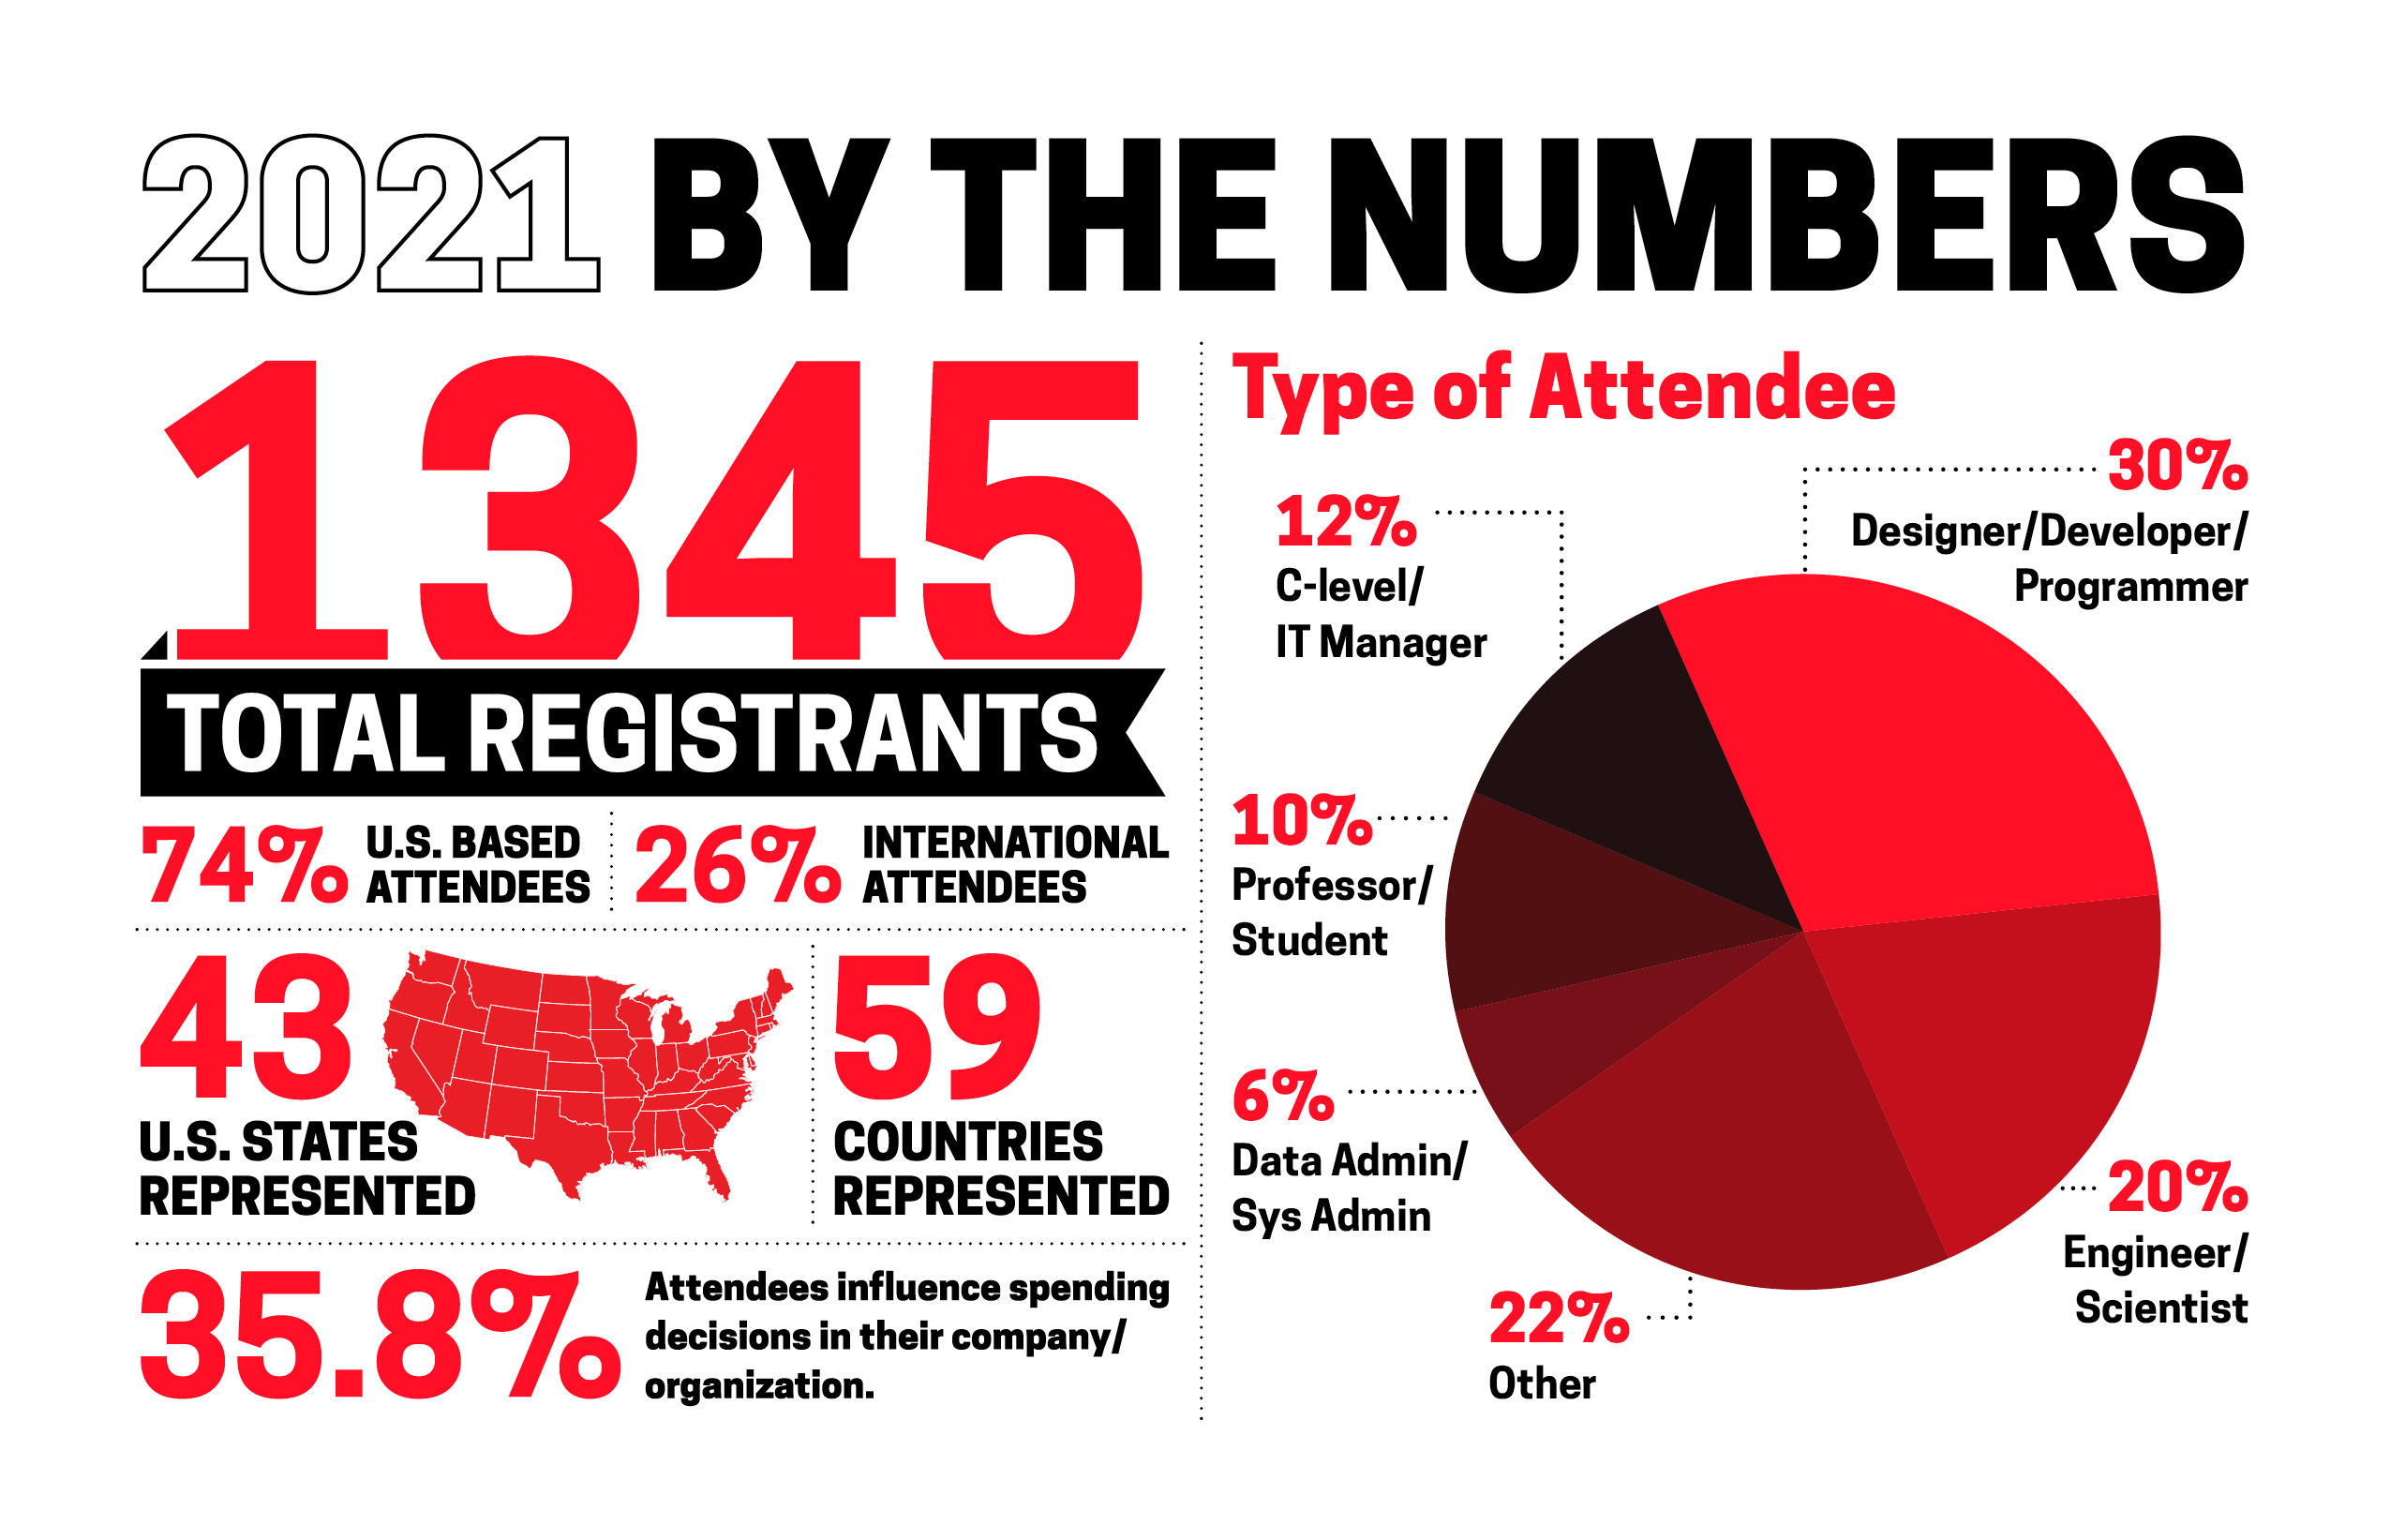
- The audience was more global than ever before - 59 countries were represented and 26% of all attendees were international.
- The keynote block was fantastic and speakers did an amazing job. Talk topics were on-point and covered a wide range of highly applicable topics.
- All speakers were truly wonderful, delivered great talks, and were a pleasure to work with. Kuddos!
- We broadcast the morning keynote block live from a conference center with a limited team - similar to what we did during All Things Open last October. We feel it went well and hope it was well received by those watching at home.
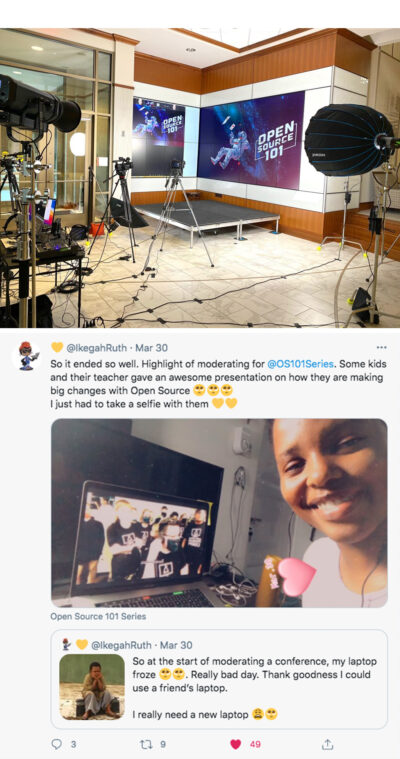
- One of our favorite moments was a tweet from one of our beloved and wonderful moderators - Ruth Ikegah. Although her day started with a computer crash, it ended with a selfie with the kids delivering the final talk of the day.
EVENT SPECIFICS
Total Registered - 1345
# of Countries Represented - 59
Argentina, Austria, Australia, Bangladesh, Belgium, Bulgaria, Brazil, Canada, Chile, China, Columbia, Czechia, Germany, Denmark, Ecuador, Egypt, Finland, France, Great Britain, Hong Kong, Honduras, Indonesia, Ireland, India, Iran, Italy, Jamaica, Jordan, Japan, Kenya, Lithuania, Luxembourg, Mexico, Niger, Netherlands, New Zealand, Norway, Phillipines, Pakistan, Poland, Portugal, Romania, Russia, Serbia, Singapore, Slovakia, Spain, Sri Lanka, South Africa, Sweden, Switzerland, Thailand, Turkey, Taiwan, United States, Ukraine, Uganda, Venezuela, Zimbabwe
# of US States Represented - 43
Alabama, Arizona, Arkansas, California, Colorado, Connecticut, Delaware, District of Columbia, Florida, Georgia, Idaho, Illinois, Indiana, Iowa, Kansas, Kentucky, Louisiana, Maryland, Massachusetts, Michigan, Minnesota, Missouri, Nebraska, Nevada, New Hampshire, New Jersey, New Mexico, New York, North Carolina, North Dakota, Ohio, Oklahoma, Oregon, Pennsylvania, Rhode Island, South Carolina, Tennessee, Texas, Utah, Vermont, Virginia, Washington, Wisconsin
U.S Based Attendees - 74%
International Attendees - 26%
Type of Attendee:
C-level/IT Manager - 12%
Designer/Developer/Programmer - 30%
Engineer/Scientist - 20%
Other - 22%
Data Admin/Sys Admin - 6%
Professor/Student - 10%
Do You Make or Influence Spending Decisions?
No - 61.5%
Yes - 38.5%
Industry Breakdown
Automotive - 1%
Banking - 2%
Consumer - 1%
Education - 11%
Electronics - 1%
Energy - 1%
Engineering - 6%
Financial - 6%
Government - 5%
Healthcare - 5%
Insurance - 1%
Legal - 1%
Manufacturing - 1%
Media - 2%
Online - 2%
Other - 11%
Retail - 1%
Technology - 39%
Telecommunications - 2%
Transportation - 1%